Skip to content

I used to walk the long aisles of a Toronto electronics chain every Sunday. I was a broke design student then, hunting bargains I could hack into new projects. One day I saw a dusty Bluetooth speaker line moved from a back wall to an end‑cap topped with a single LED strip. By Monday morning the stock was gone. That five‑second discovery made me ask a big, simple question: does design really drive sales, or did I just witness luck wearing neon?
I kept that question close when I joined Feilong Acrylic. Now, after thirteen years of building custom fixtures for brands on five continents, I think I can give Jacky—our Canadian friend buried in BOMs—a clear, no‑fluff answer.
Layout comes first, because nothing sells if people cannot find it.
The Role of Store Layout and Visual Merchandising
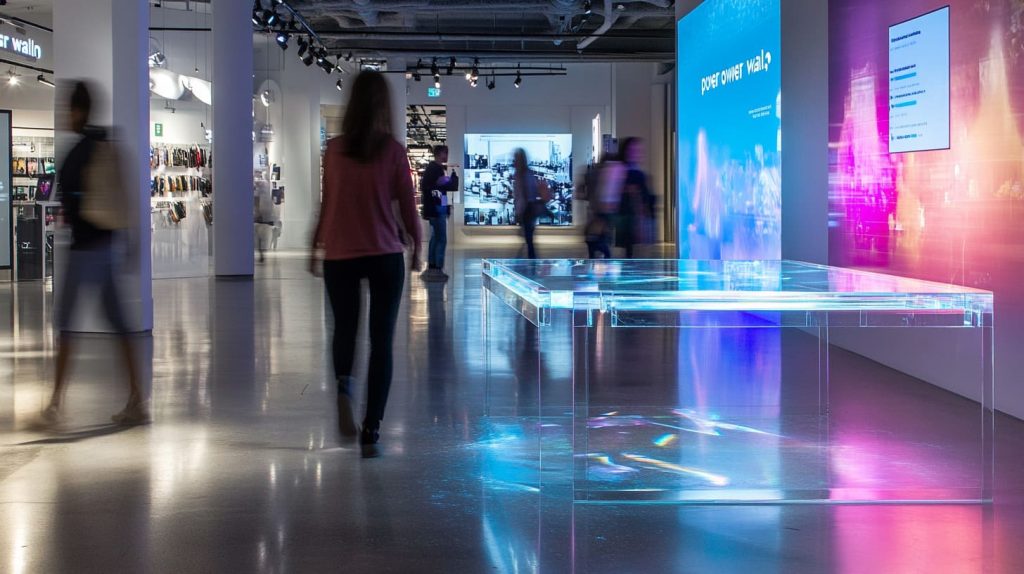
I like to sketch store traffic the way subway planners trace tunnels. Shoppers need clear “tracks” that loop from decompression zone to checkout. A narrow aisle forces elbows, so baskets stay empty. Wide curves invite pause. I often place our acrylic demo tables on a right‑hand power wall because 90 % of visitors instinctively turn right. Simple math.
Product Placement and Cross‑Merchandising
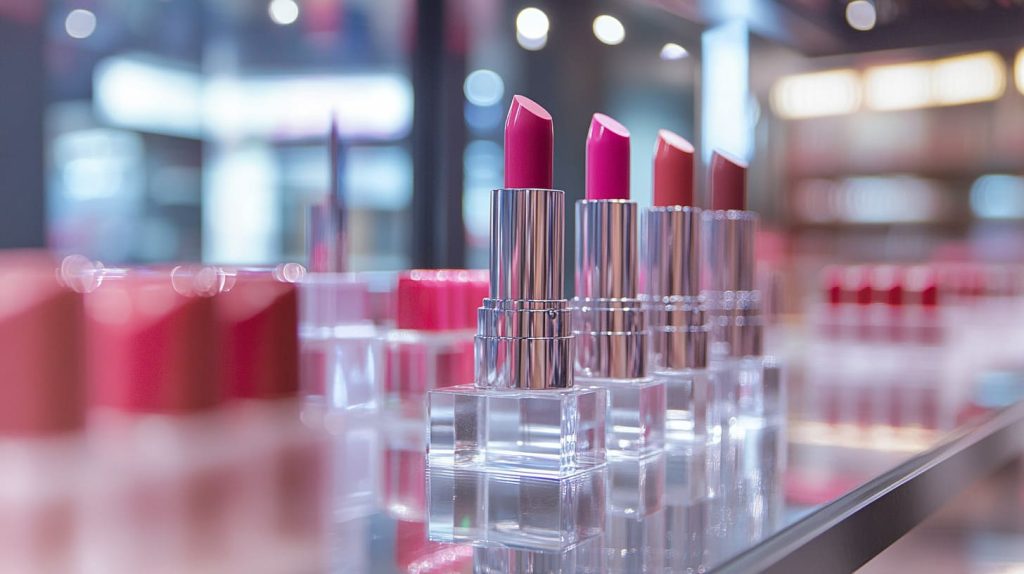
When I pair clear lipstick risers beside mirrored acrylic trays, cosmetics jump 18 % in ticket value. Why? People imagine the set at home. A mountain‑gear client once grouped water bottles with climbing hooks; basket sizes climbed like the Alps. Cross‑merchandising is quiet upselling.
Signage and Wayfinding
Hand‑lettered chalkboards feel warm, but they fail past three meters. I recommend PVC lettering plus LED halo for any aisle marker. Clear, bright, low glare. A lost shopper buys nothing, a guided one browses visual merchandising statistics before their coffee cools.
Bridge: Good layout pulls shoppers in, but brand identity holds them. Let’s dig into that next.
Brand Identity and Customer Experience
Designing for Brand Consistency
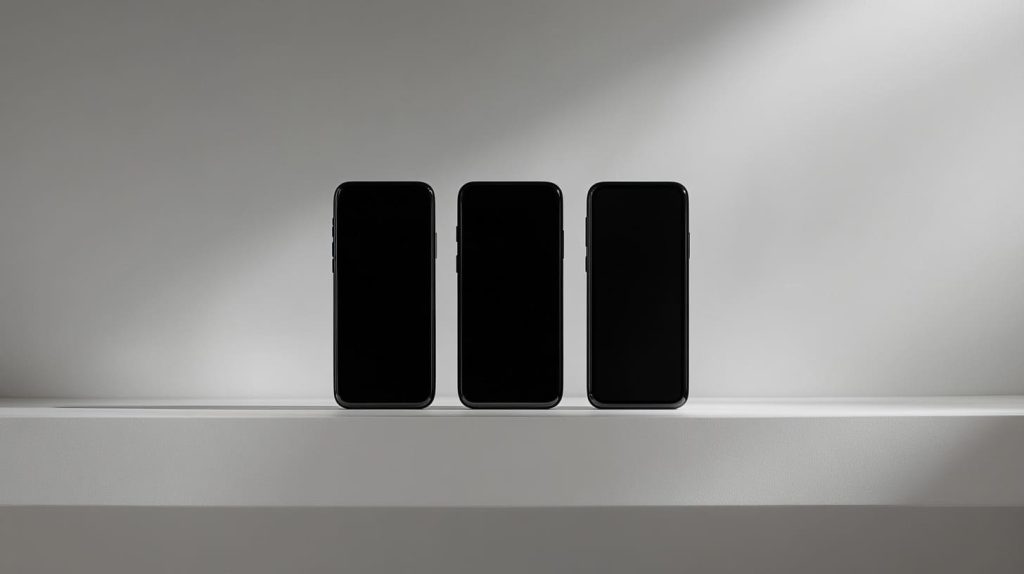
Branding is memory glue. I once built matte‑black acrylic phone stands for a tech label that lives on minimalism. The stands matched their unboxing videos pixel‑for‑pixel. Shoppers said, “It feels like the website came alive.” Consistency lowers doubt.
Immersive Retail Environments
Think of the Apple Store’s long oak tables. People touch, tinker, ask. In contrast, a perfume boutique I visited in Guangzhou wrapped shelves in mirrored acrylic and velvet—sudden glamour, instant Instagram posts. Immersion is not copy‑paste design; it grows from core values.
Sensory Branding: Lighting, Sound, and Scents
Warm LEDs soften skin‑care counters. Cool spotlights sharpen gadget edges. A subtle citrus scent near yoga gear lifts mood without shouting. Even background jazz can set pace. Every sense whispers, “Stay a little longer.”
Bridge: Feelings are powerful, so let’s break them down with psychology and color.
Emotional and Psychological Impact of Retail Design
First Impressions and the Decompression Zone
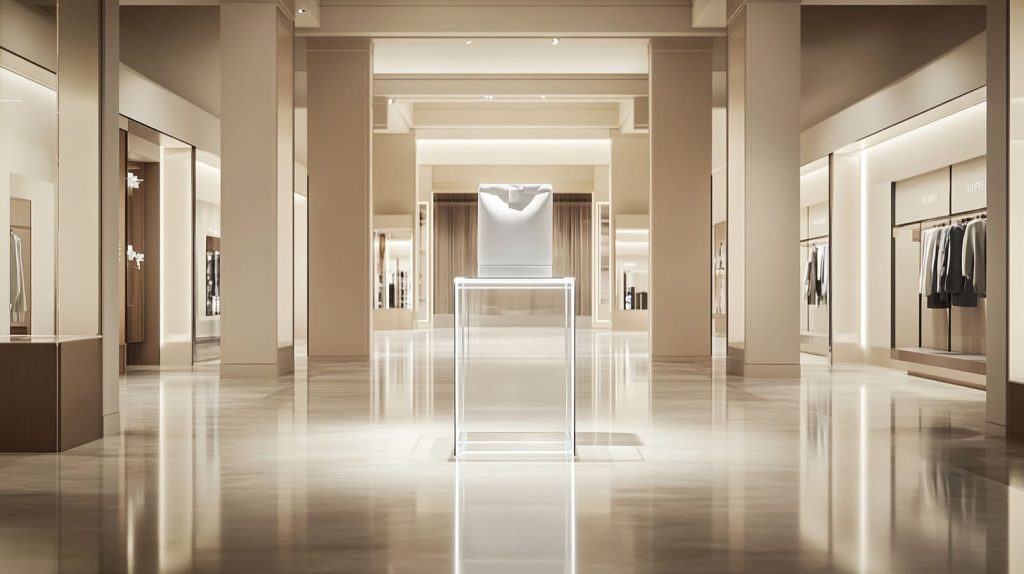
The first three paces after the door decide if pockets open. I keep this strip clean: no hard sells, no clutter. One hero item on a clear riser, light from above—that’s it.
Color Psychology and Atmosphere
Blues soothe, reds rush, green plants hint sustainability. Once I swapped purple shelf liners for ivory in a home‑linen store; dwell time rose 12 %. Check hard data on color psychology in retail if in doubt.
Creating a Sense of Belonging and Comfort
Seating says “you belong.” A quick perch near trial mirrors doubles fitting‑room use. Rugs hush footfall so conversations feel private. Comfort buys minutes, and minutes convert.
Bridge: Tech can stretch those minutes further—if we integrate it well.
Technological Integration and Omnichannel Experience
Seamless Digital‑Physical Interactions
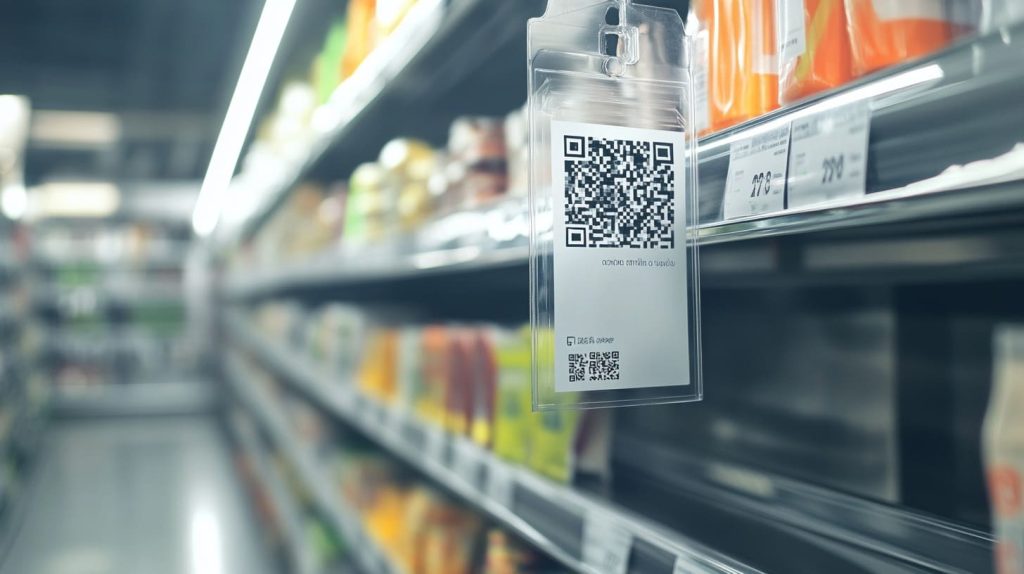
QR codes on our acrylic price tags push specs to phones in one tap. No staff? No wait. Stock syncs in real time, so online carts mirror in‑store shelves.
Interactive Displays and Smart Fitting Rooms
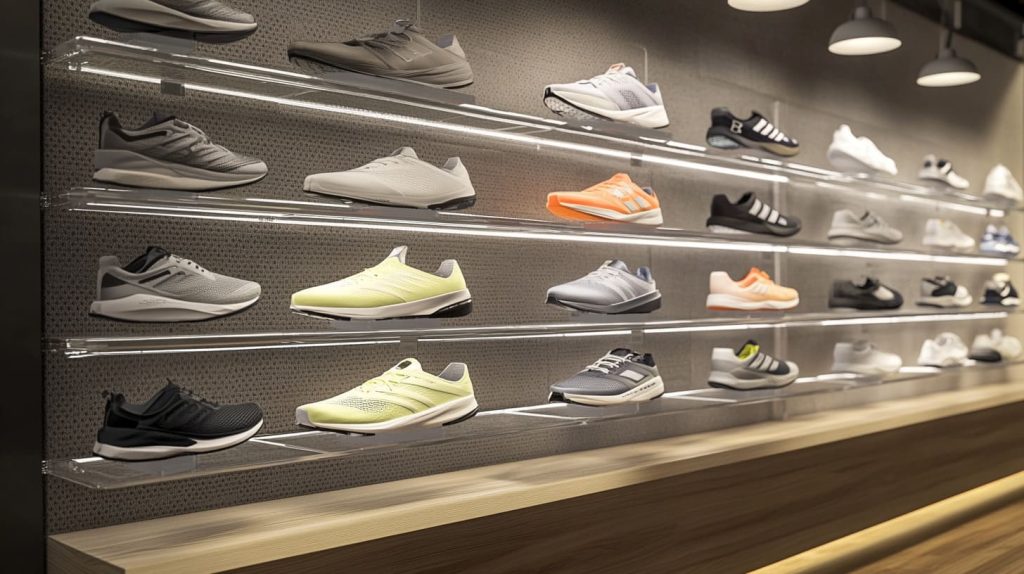
A shoe wall in Seoul used RFID pegs: lift a sneaker, a micro‑film plays on the screen. Returns dropped, confidence soared. Smart mirrors do the same for fashion, overlaying sizes without a zipper struggle.
Data‑Driven Personalization
Heat‑mapping cameras show cold corners. We rearranged an organizer display accordingly and gained a hidden “hot spot.” Data is the compass in a maze of choices. Case studies of omnichannel retail examples prove the point.
Bridge: Numbers persuade owners. Let’s link design to hard sales next.
Design’s Influence on Sales Performance and Loyalty
| Metric | Poor Design | Good Design | Typical Lift |
|---|---|---|---|
| Foot Traffic | Baseline | +20 % | 15‑25 % |
| Dwell Time (minutes) | 3.5 | 6.0 | 50‑80 % |
| Conversion Rate | 18 % | 26 % | 6‑10 pts |
| Average Order Value (USD) | 42.00 | 54.60 | 20‑30 % |
Impact on Foot Traffic and Dwell Time
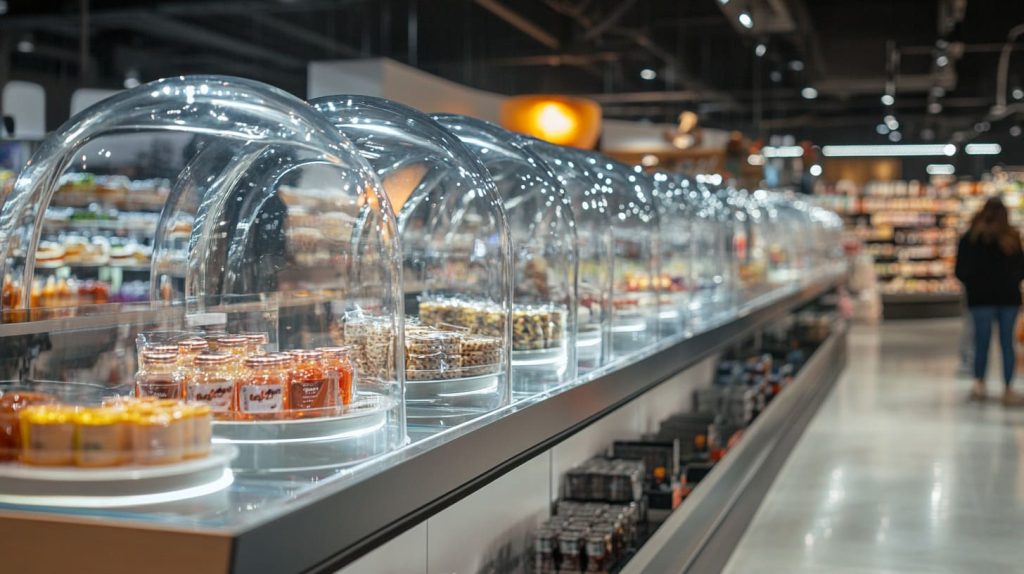
Bright windows lure walkers. Clear sightlines keep them curious. One grocery client added acrylic tasting pods at the mid‑aisle bend; dwell time grew so queues formed.
Conversion Rates and Average Order Value
When layout guides discovery, remote items turn into impulse buys. A cross‑sell rack near checkout bumped cable sales by 23 % last quarter.
Fostering Repeat Visits and Brand Loyalty
Consistency plus comfort equals habit. I still visit that end‑cap speaker aisle. I may not buy, but the familiarity feels good, and someday I will.
Bridge: Performance is great, yet design must also work for all bodies and budgets.
Practical Elements of Effective Retail Design
Accessibility and Universal Design
Ramps, 900 mm aisle widths, lever handles—basic respect. In Canada, skipping these means fines. In China, it means lost praise on social media.
Flexibility and Modular Fixtures
Our clear panel system assembles with thumb screws. Swap heights in five minutes. Trends shift fast; fixtures must dance along.
Sustainability and Material Selection
Eco‑acrylic from GSG resin cuts carbon 30 % vs. virgin PMMA. Brands show the certificate at shelf edge. Shoppers nod, and sometimes that nod unlocks wallets.
Bridge: Managers will ask, “Is the makeover worth every penny?” We need numbers.
Measuring the ROI of Retail Design
Key Performance Indicators for Design
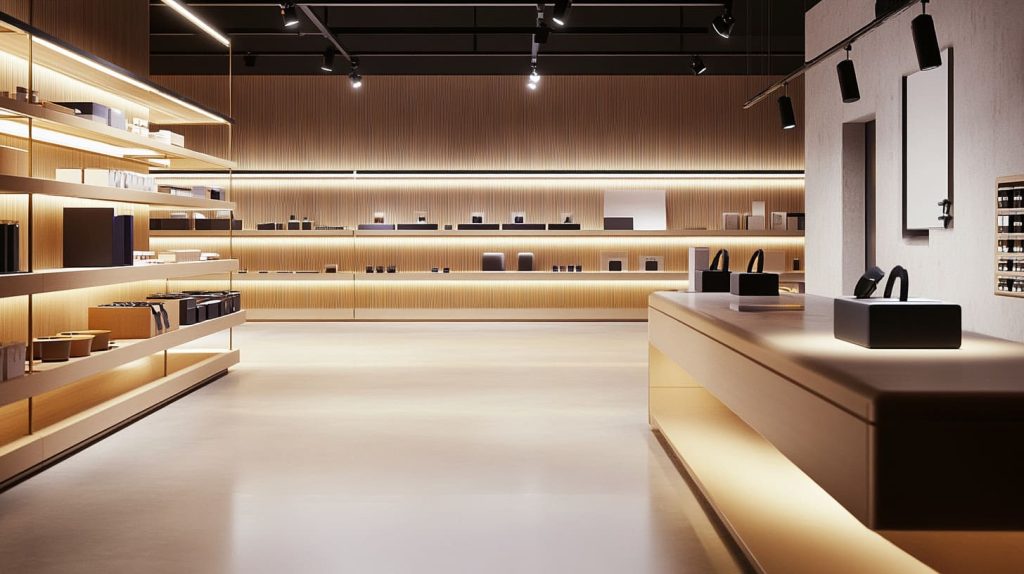
Watch foot traffic, dwell, conversion, AOV, return rate. Track monthly and after each layout tweak.
A/B Testing Layouts and Visual Merchandising
Split two identical stores or rotate zones fortnightly. Record. Compare. Decide. No ego, just evidence.
Cost‑Benefit Analysis
Acrylic risers cost $12 each. If they add $300 weekly in lipstick sales, payback is four days. Simple table, quick nod from the CFO.
Bridge: Where does design head next? Let’s explore tomorrow’s toolkit.
Future Trends in Retail Design
Sustainability and Eco‑Friendly Design
Recycled PMMA, bamboo panels, low‑energy LEDs. Consumers now check source stories.
Personalization through AI and AR
AR phone filters show how that acrylic coffee table looks in a condo. AI suggests matching décor. Tailor‑made shopping, minus the tailor.
Pop‑Up and Experiential Retail Concepts
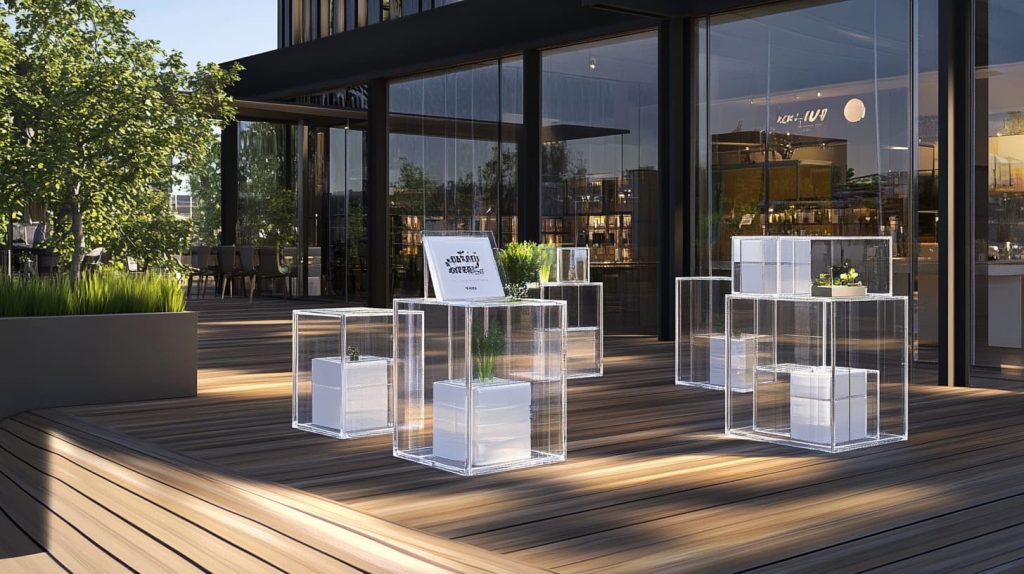
Short‑term bursts test new markets. Our flat‑pack acrylic cubes ship in a day, build in an hour, vanish in a night. Flexibility is freedom.
Bridge: After all the angles, I owe you a straight answer.
Conclusion
Design matters as much as rent and inventory—sometimes more. It guides feet, sparks feelings, and prints numbers on the ledger. I learned this the hard way, lugging crates of stands across exhibition floors. When a display clicks, stock melts. When design slacks, even discounts yawn. So next time you plan a store, treat layout as strategy, not decoration. Your future self, counting sales at 9 p.m., will thank you.